


PrometheusのExporterは自作することができ、先人が既に簡単な書き方の記事を挙げています。 しかし、タイトルにある通り辞書型のような形式でメトリクスを保持するような方法が記載されているドキュメントは見当たらなかったので、ブログにしてみようと思いました。
動作環境
- macOS
- Ventura 13.2.1
- Go
- 1.20.3
- Rancher Desktop
そもそもPrometheusとは?Exporterとは?
Prometheusはざっくり言うと、「メトリック監視のために時系列ごとの値を保存することができるOSS」です。 値の収集はymlで定義されたExporterと呼ばれるものからPrometheus側からスクレイピングをしており、そこで収集したデータを独自の圧縮形式でファイルに保存しています。 Prometheusで収集したデータはPrometheusのWeb UIまたはGrafanaなどの可視化ツールでpromqlと呼ばれるクエリを使うことで値の取得やグラフの描画ができます。

詳しくは 公式ドキュメント を参考にしてみてください。
ソースコード
今回はプロセス監視のため、 ps コマンドで取得したcpu使用率をアプリケーションのファイルパスをキーとするような辞書型のメトリクスで出力できるようにExporterを実装しました。
package main

import (
	"flag"
	"net/http"
	"os/exec"
	"strings"
	"strconv"
	"time"

	"github.com/prometheus/client_golang/prometheus"
	"github.com/prometheus/client_golang/prometheus/promauto"
	"github.com/prometheus/client_golang/prometheus/promhttp"
)

// メトリクスの名前空間用の変数
var namespace = "process"

// メトリクス保持をする変数
var cpuUsagePercentGauge = promauto.NewGaugeVec(
	prometheus.GaugeOpts{
		Namespace: namespace,
		Name:      "cpu_usage_percent",
		Help:      "cpu usage percent by process",
	},
	[]string{"filename"},
)

// メトリクス収集用の関数
func Collect() {
	// psコマンドの実行結果を取得
	commandResult, _ := exec.Command("/bin/zsh", "-c", "ps aux | awk '{ printf(\"%s,%s,%s,%s,%s,%s,%s,%s,%s,%s,%s\\n\",$1,$2,$3,$4,$5,$6,$7,$8,$9,$10,$11);}'").Output()
	convertedCommandResult := string(commandResult)
	convertedCommandResultArray := strings.Split(convertedCommandResult, "\n")

	// 取得した実行結果からアプリケーションのファイルパスをキーとしてcpu使用率を代入
	for i := 0; i < len(convertedCommandResultArray) - 1; i++ {
		row := strings.Split(convertedCommandResultArray[i + 1], ",")
		if len(row) > 10 {
			cpuUsagePercent, _ := strconv.ParseFloat(row[2], 64)
			fileName := row[10]
			cpuUsagePercentGauge.With(prometheus.Labels{"filename": fileName}).Set(cpuUsagePercent)
		}
	}
}

func main() {
	flag.Parse()

	// 並列処理で無限ループ
	go func() {
		for {
			// メトリクス収集
			Collect()
			// 一度メトリクス収集してから30秒待つ
			time.Sleep(30 * time.Second)
		}
	}()

	// localhost:8191で待機
	http.Handle("/metrics", promhttp.Handler())
	http.ListenAndServe(":8191", nil)
	Collect()
}
環境構築
Exporter
作成したソースコードをビルドして実行ファイルを生成した後、コマンドラインで実行しておけばExporter側の準備は完了です。
Prometheus
予め適当なディレクトリに prometheus.yml を配置しておきます。
global:
  scrape_interval: 15s
  evaluation_interval: 15s
scrape_configs:
  - job_name: 'process_exporter'
    static_configs:
    - targets: ['host.docker.internal:8191']
その後また別のディレクトリで docker-compose.yml を配置します。
version: '3'
services:
  prometheus:
    image: prom/prometheus
    container_name: prometheus
    volumes:
      - /path/to/prometheus.yml:/etc/prometheus/prometheus.yml
    ports:
      - 9090:9090
最後に docker-compose.yml を配置したディレクトリで下記コマンドを実行すればPrometheus側の準備は完了です。
実行結果
http://localhost:9090 をブラウザで開いた後、クエリの入力欄に process_cpu_usage_percent と入力して Execute ボタンを押せば確認できます。
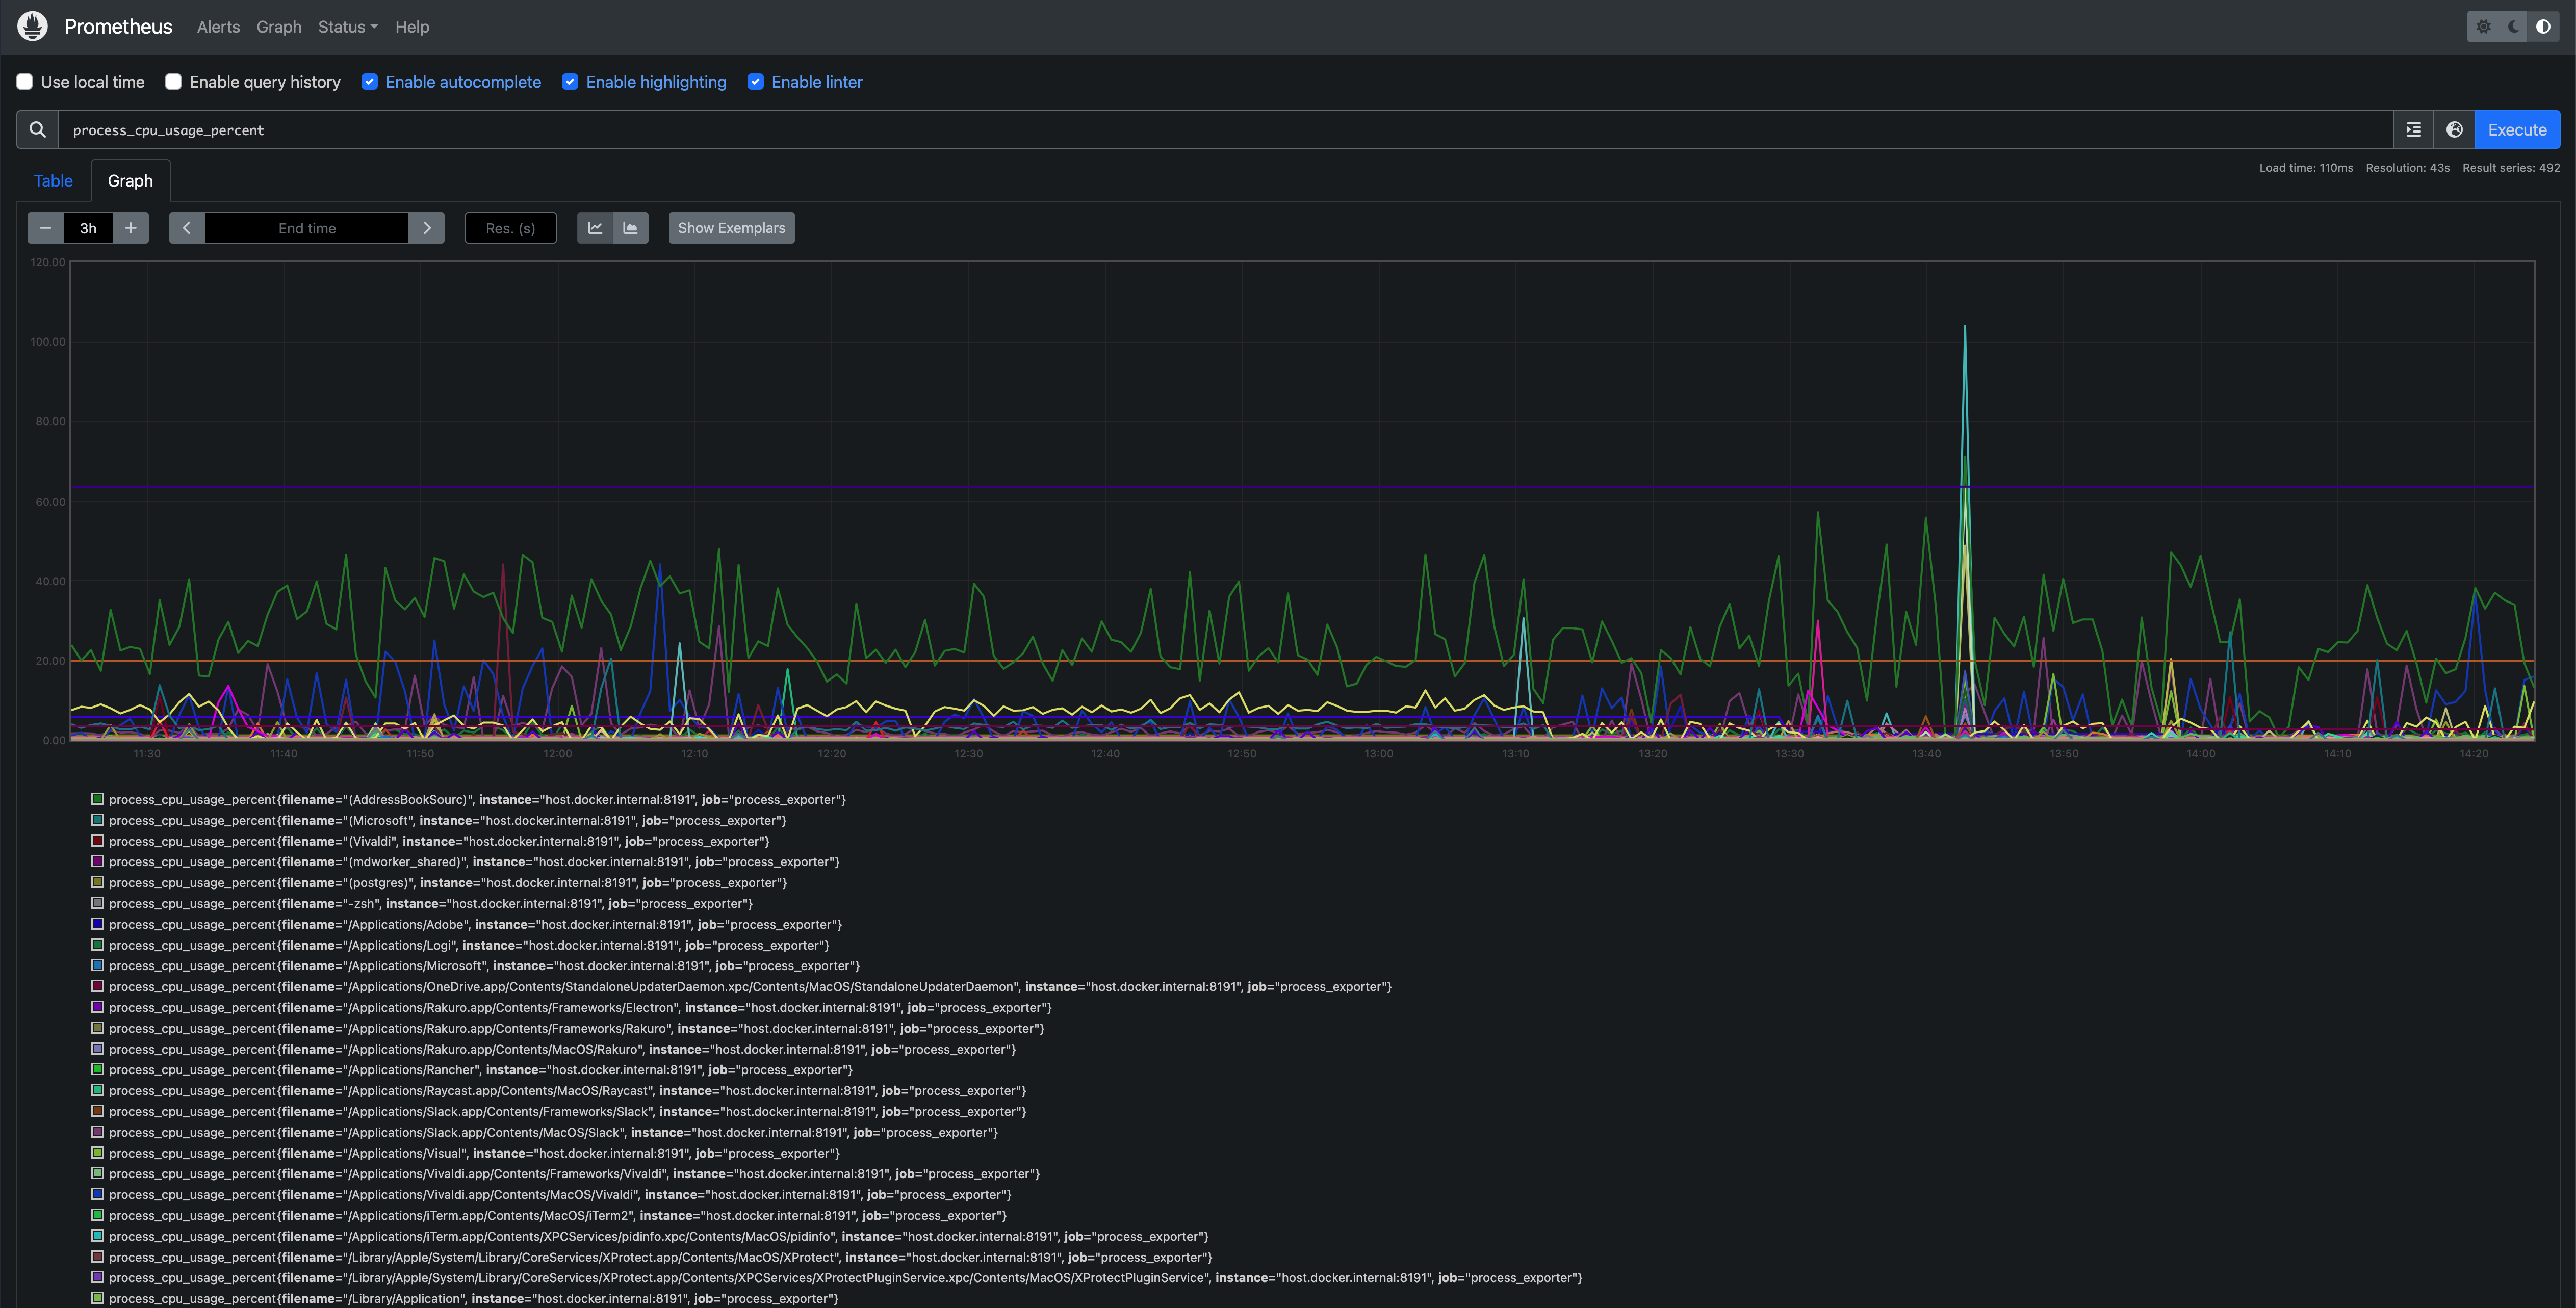
また、クエリを編集すれば出力するプロセスの絞り込みができたり、関数を使って合計値をグラフで出力することも可能です。
感想
今回はローカルマシンでプロセスを監視しましたが、VM上で実行すればVMのプロセス監視を行うことができるはずです。加えて、外部からPrometheusにアクセスできるようにすればわざわざVMに接続してタスクマネージャーなどを開かなくてもweb上から閲覧することができます。そういう仕組みづくりができればVMの負荷が高騰した時もどのプロセスが原因なのか後から調査する場合でも対応ができるようになると思います。
こういった仕組みづくりはやっぱり好きだなぁとコードを書いていてしていてしみじみ思いました。


![Microsoft Power BI [実践] 入門 ―― BI初心者でもすぐできる! リアルタイム分析・可視化の手引きとリファレンス](/assets/img/banner-power-bi.c9bd875.png)
![Microsoft Power Apps ローコード開発[実践]入門――ノンプログラマーにやさしいアプリ開発の手引きとリファレンス](/assets/img/banner-powerplatform-2.213ebee.png)
![Microsoft PowerPlatformローコード開発[活用]入門 ――現場で使える業務アプリのレシピ集](/assets/img/banner-powerplatform-1.a01c0c2.png)